A Market Basket Analysis of A Grocery's Customer Transactions

retail

Simply put, Market Basket Analysis is conducted to help find associations in a data set. It can yield results that show which items are frequently bought together and at the same time learn the purchasing behavior of customers.

When conducting a Market Basket, analysts usually look for two things first:
  • Support - a count of the number of times where a combination of items (or itemsetsoccured
  • Confidence - the probability that a rule will occur (ex. the confidence or conditional probability that people that bought shampoo and conditioner will also buy a bar of soap)

One can also measure the relationship of the items in each rule when exploring the results:
  • Lift - a score that shows the strength of correlation or relationship. Zero means no correlation while a positive score means that the items on the left hand side (antecedent) predict the items on the right hand side (consequence) of the rule

What is Apriori?

Principle:

  • If an itemset is frequent, then all of its subsets must also be frequent and vice versa
  • Support of an itemset never exceeds the support of its subsets
What it does:
  • Calculates the support for single itemsets one at a time
  • Itemsets that are less than the declared minimum support (minsup) are discarded
  • After that, it then expands to evaluating two-items itemsets and so on and so forth
It's pretty simple and commonly used but it's also known to be very slow for very large item sets. This is because Apriori uses a breadth-first search meaning it goes through the data multiple times (i.e. Single item itemsets first, and then run through the data again for the two-item ones, and then the three-item ones, etc.). Singularities.com ran a test to prove this:


What data are going to use?

The Groceries data set contains 1 month (30 days) of real-world POS data from a typical local grocery outlet. The data set contains 9835 transactions and the items are aggregated to 161 categories

Results

Support guide for rule generation
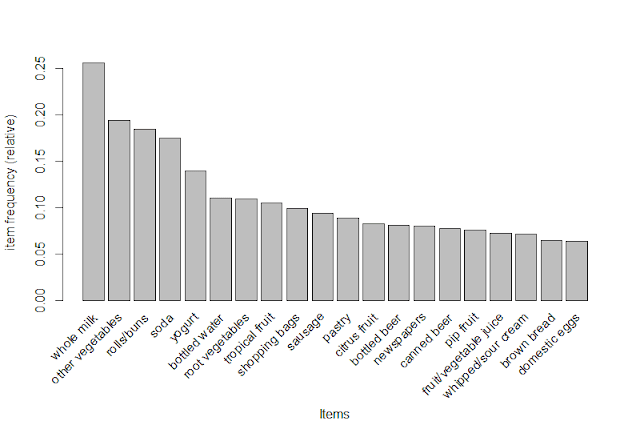
Whole milk is the most frequently bought item in the data. We will use its 0.25 support as guide in setting the minimum support for rule generation.

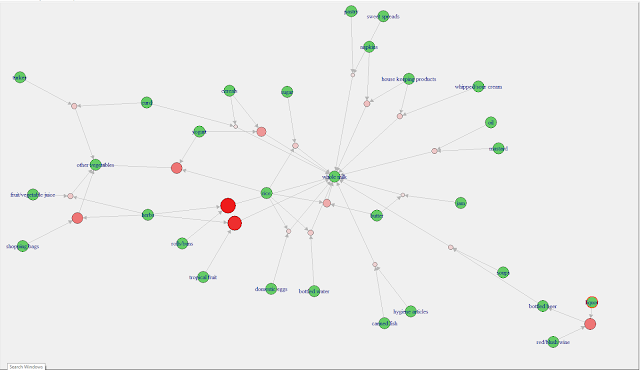
Rules Generated in text format. I shortened the list to 20 for readability. The study yielded 410 results in total (see code below). As an example, if a customer bought liquor and red/blush wine, there is a 90% chance (with 11.2 Lift) that bottled beer will be bought too.

Rules in graph format. The redder the circle, the higher the lift.


RCode:


Comments

  1. Online Casino in NJ - Atlantic City - Ambienshoppie
    The online casino is an open-to-play casino where players can enjoy casino games for free and without any wagering requirements. The online casino is 온라인 카지노 처벌

    ReplyDelete

Post a Comment