Market Basket Analysis is usually used to help find which items are frequently purchased at the same time. By doing so, it provides insights into the purchasing behavior of customers that can help a business increase sales and maintain inventory. A simple example would be the occurrence of shampoo and conditioner in the same sales transaction. However, the real value of
The legend says that a study was done a retail grocery storeThe findings were that men between 30- 40 years . age, shopping between 5pm and 7pm on Fridays, who purchased diapers were to also have beer in their carts. This motivated the grocery store to move the beer isle closer to the diaper and wiz-boom-bang, instant 35% increase in sales of both. in
Two General
1. Calculate support for combinations of itemsBasket 1: A, B
Basket 2: A, C
Basket 3: A, D, E
Basket 4: B, C, D
Basket 5: A, B, D, E
X
A: in 4 baskets
B: 3
C: 2
D: 3
E: 2
Calculate Support to determine how common these
A: appears 4 times/5 baskets = 0.8 (80%)
B:. 3/5 = 0.6 (60%)
C: 2/5 = 0.4 (40%)
D: 3/5 = 0.6 (60%)
E: 2/5 = 0/4 (40%)
2. Calculate confidence or conditional probability
How often does each individual item occur given:
Basket 1: A, B
Basket 2: A, C
Basket 3: A, D, E
Basket 4: B, C, D
Basket 5: A, B, D, E
= basket 3 and basket 5 both have A and D so (2/5
= if a person buys A and B then there's a 50% chance he will also buy D
What is FP-Growth Algorithm?
Goal
Given a set of transactions, find all rules or associations having support >= minimum support threshold and confidence >= minimum confidence threshold.What data are going to use?
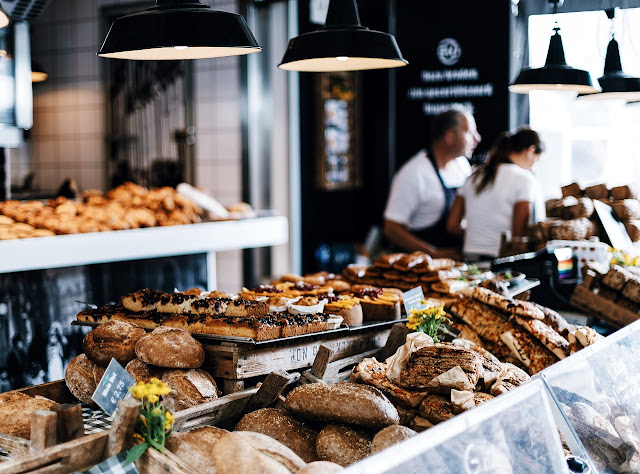
The Extended Bakery Dataset contains 5,000 rows listing the transactions involving a bakery's 50-item menu.Invoice (or Receipt) No.
What's under the hood?
Minimum Support: 0.03
Minimum Confidence: 0.8
Results:
 |


Comments
Post a Comment