A hypothetical bank in the United Kingdom wants to learn more about its customers in order to effectively market existing and new financial products and services.
Data:
The hypothetical customer info data set has 36,165 rows containing the ff.:
- Customer ID
- Whole name
- Gender
- Age
- Region (England, Scotland, Northern Ireland, and Wales)
- Job Classification (White Collar, Blue Collar, Others)
- Date Joined
- Account Balance
Sample table:
Goal:
Deliver key insights to help the bank to customize its products and services according to a region's customer segmentation.Tableau Slides and Interactive Table:
 | ||||
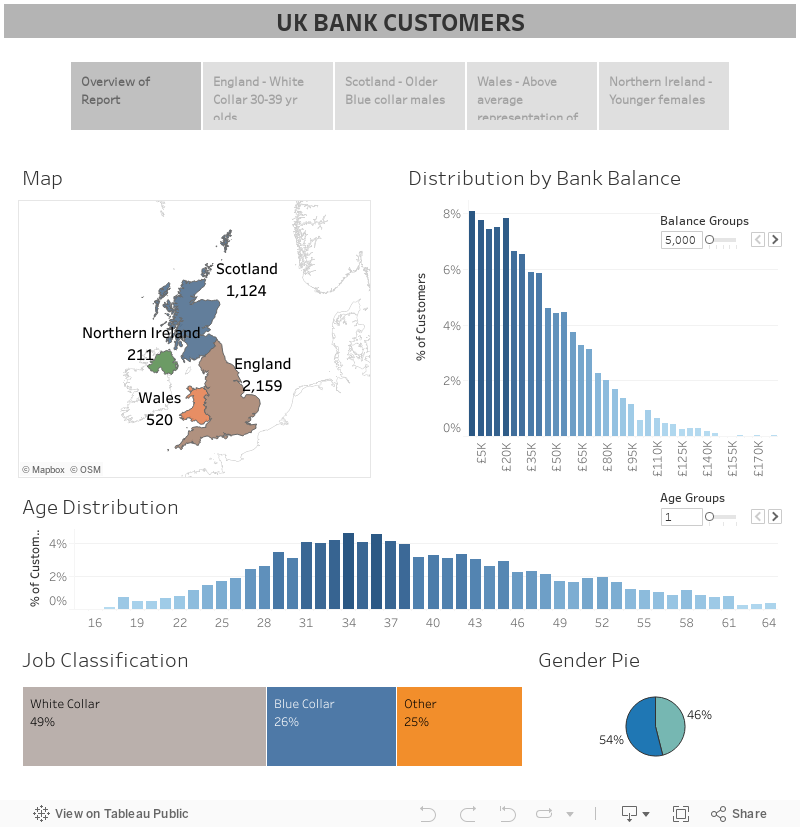
The map shows the customer population per region in the United Kingdom. Majority of which have an account balance between 1K to 40k (British Pounds) and are mostly owned by men between 26-48 years of age. 49% of the total no. of clients are in White Collar jobs.
 Wales has an above average representation of mid-sized balances. Most clients are aged 30-44 years old, male, and have White Collar jobs.  |


Comments
Post a Comment